SMOOTH & PRECISE OPERATION

01
HPTLC Analysis – Made Easy: Create your own method with a few mouse clicks.

02
Guided Analysis: Select a method and visionCATS will guide you

03
Sample View: All available data related to the sample are displayed

04
Data Preview: Provides an overview of steps and samples of an analysis or method

05
With visionCATS, it is possible to compare profiles of samples developed in different analyses.

01
Data View: All data gathered through the chromatographic process can be reviewed and processed

02
Comparison Viewer: Side by side view of tracks from the same or different plates and/or detection modes

03
Spot Amp efficiently supports the localization of even the smallest fractions on the plate by increasing or decreasing the contrast of the zones.

01
Peak Assignment: The separated compounds are assigned. For quantification, data from the multi-wavelength scan at the optimum wavelength for each compound is used.

02
3D View and Peak Integration: Densitograms are displayed in 3D, top or front view. Several peak integration and baseline correction settings can be selected.

03
Calibration Curve: For evaluation the best fitting calibration model is used. Quantitation can be done via peak height or area.
powered by ai
powerful AI tools for significantly enhanced HPTLC data interpretation

Peaks Acceptance Criteria
The Peaks Tool enables users to compare substances and define statistically reliable acceptance ranges.
- Show acceptance limits for peak data (area and height) using Min / Max or Confidence Interval algorithm, with the ability to exclude outliers for more robust criteria.
- Quickly assess signal patterns (RF, peak height, and area) using interactive scatter plots or box plots.
- Automatically group peaks by track, analysis, and wavelength, while allowing adjustment of RF ranges to maintain consistency across different plates.

Classification
The Classification tool brings AI-driven pattern recognition and grouping into visionCATS, removing subjective interpretation in data evaluation.
- Choose between predictive modeling using labeled references data (Supervised Classification) or exploratory clustering for unlabeled data (Unsupervised Classification).
- Utilize dimensionality reduction techniques such as PCA or t-SNE, combined with comprehensive preprocessing, to reduce noise and enhance algorithmic performance.
- Explore results through high-resolution 2D and 3D visualizations, revealing hidden patterns and relationships within the dataset.

Spectrum Library
visionCATS 4.1 introduces the Spectrum Library feature, along with three specialized libraries, offering significant benefits for HPTLC users in pharmacognosy, forensic science, and pharmaceutical quality control. This enhancement enables users to compare UV spectra obtained from the TLC Scanner 4 with a carefully curated library, improving analysis accuracy and efficiency.
Key Benefits
Faster, More Accurate Identification
Efficient Data Interpretation
Reliable Detection of Adulteration & Contaminants
Accelerated Research & Development
Easy identification of unknown compounds

Available Libraries
Forensics
Phytochemicals
UV spectra of 222 substances
Pharmaceuticals
UV spectra of 369 substances
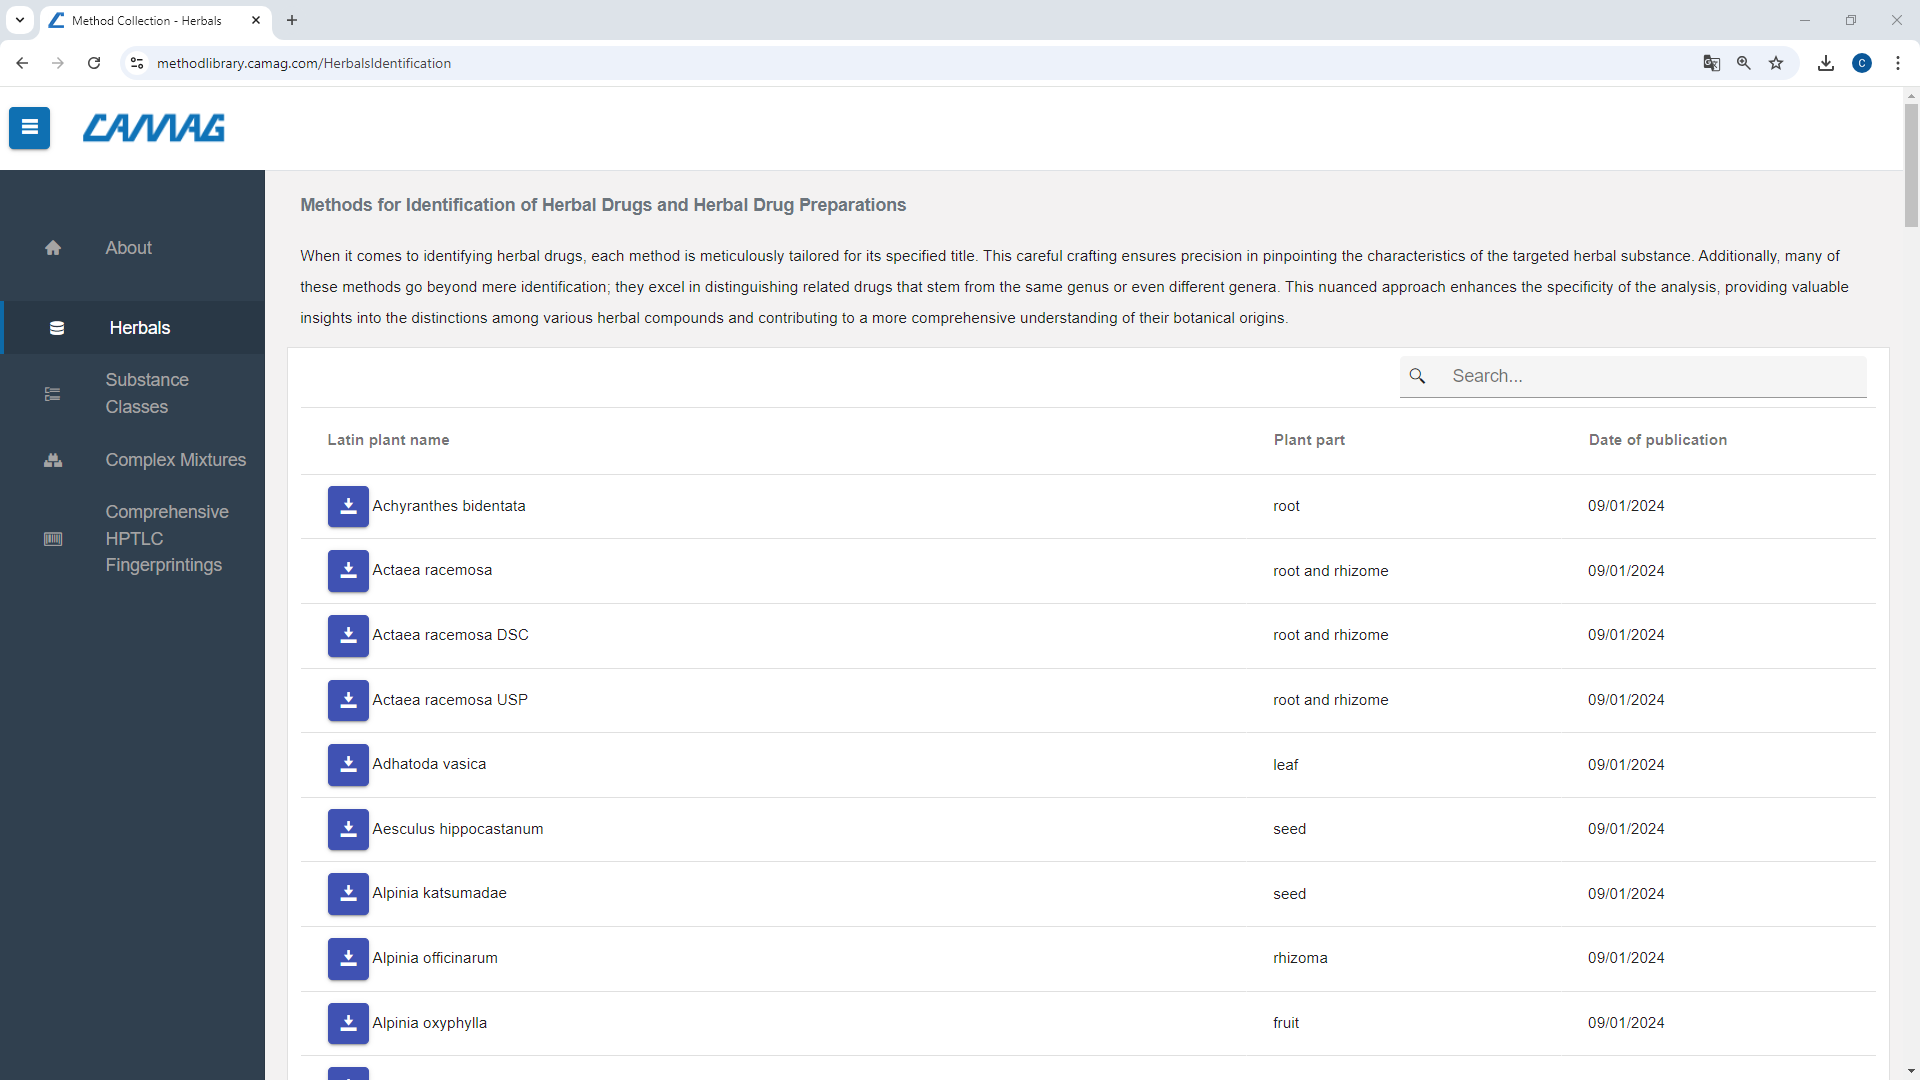
Method Library
For analysts using HPTLC for identification of herbal drugs or analysis of food samples, visionCATS offers breakthrough support with the visionCATS Method Library. As a licensed user, you can download methods from the visionCATS Method Library free of charge and import them into your own visionCATS database.