The research team at the University of Western Australia (UWA), Division of Pharmacy, developed an HPTLC based real-time honey assessment tool for beekeepers and packers to determine a honey’s floral source alongside the collation of key phytochemical parameters and bioactivity data for a wide range of Australian honeys. Currently, the team is using HPTLC as a qualitative and quantitative honey analysis tool. They monitor changes over time, and caused by storage and handling conditions.
Introduction
Honey is a sweet natural product appreciated for its unique flavor, color and bioactivity. Honey is produced by honeybees from flower nectar. Raw honey contains phenolics, flavonoids, proteins, vitamins and minerals, however, it is rarely sold on the market in the raw form. Before being bottled and packaged, honey undergoes several processing steps, including filtration, radiation and/or heating. Excessive or prolonged heating can have detrimental effects to the honey’s quality. It is known to produce potentially toxic chemicals like the Maillard reaction product 5-hydroxymethyl-furfural (HMF), which is suspected to have carcinogenic effects when ingested in high doses. An HPTLC based method can be used for the fast and cost-effective assessment of the HMF content of honey and thus presents a convenient honey quality control tool.
The applied method is rapid, reliable, and repeatable and, therefore, a convenient analytical tool for routine quality control of honey. The method involves a simple dissolution step followed by a short chromatographic development time (9–10 min) without chamber saturation or derivatization. Up to 10 samples can be analyzed on a single plate with only small sample quantities (approx. 1 g) required.
Standard solution
Aqueous 0.008% (w/v) freshly prepared HMF solution.
Sample preparation
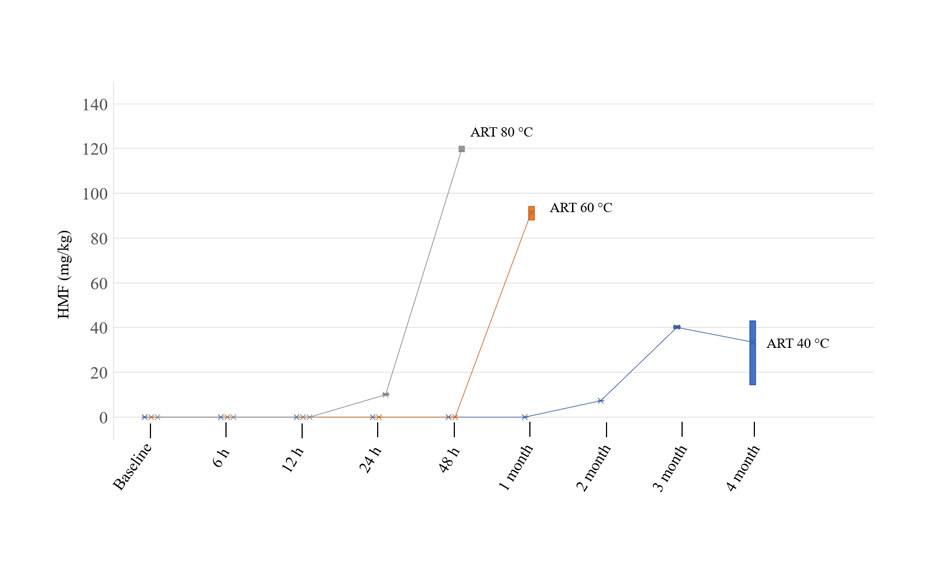
An artificial (ART) honey is prepared by dissolving 40.5 g fructose, 33.5 g glucose, 1.5 g sucrose and 7.5 g maltose in 17 mL of deionized water. The ART is individually kept at 40 °C, 60 °C and 80 °C. Sampling is done at time of preparation (t0), 6 h, 12 h, 24 h, 48 h and then over a period of four months. For HPTLC analysis, the collected honey samples are prepared as 1 g/10 mL aqueous solutions.
Chromatogram layer
HPTLC plates silica gel 60 F254 (Merck), 20 x 10 cm are used.
Sample application
Samples and standard solutions are applied as bands with Linomat 5, 15 tracks, band length 8.0 mm, distance from left edge 20.0 mm, distance from lower edge 8.0 mm.
Chromatography
Plates are developed in the ADC 2 without chamber saturation with ethyl acetate as mobile phase to the migration distance of 50 mm (from the lower edge), followed by drying for 5 min.
Documentation
Images of the plate are captured with the TLC Visualizer 2 in UV 254 nm.
Densitometry
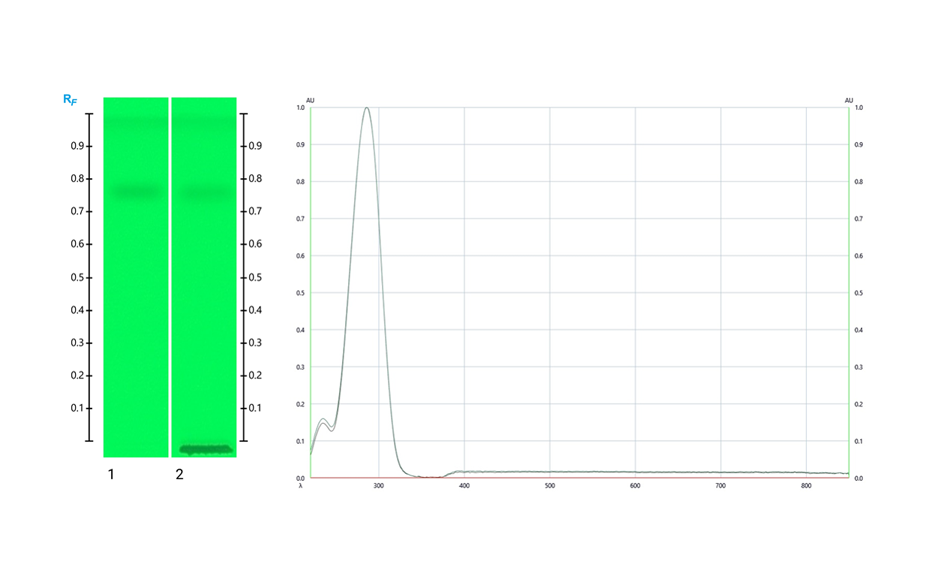
To find out the absorption maximum for HMF, a spectral scan is performed using the TLC Scanner 4 from 220 nm – 850 nm both on the bands of pure HMF and HMF bands produced in artificial honey treated at elevated temperature. Based on these scans, HMF analysis in honey samples is carried out at 290 nm using the TLC Scanner 4.
Results and discussion
The following figure shows the HPTLC fingerprints of pure HMF and HMF produced during storage at elevated temperature. During the analysis, the HMF is completely separated from the honey matrix, and both pure and newly produced HMF appear at RF 0.76. Positive identity of HMF is indicated by spectra comparison of standard and sample. The absorbance maximum is identified at 290 nm.

HPTLC image of HMF in UV 254 nm (left; track 1: Standard HMF and track 2: HMF produced in honey stored at elevated temperature) and UV-VIS spectra of HMF from 220 – 850 nm (right).
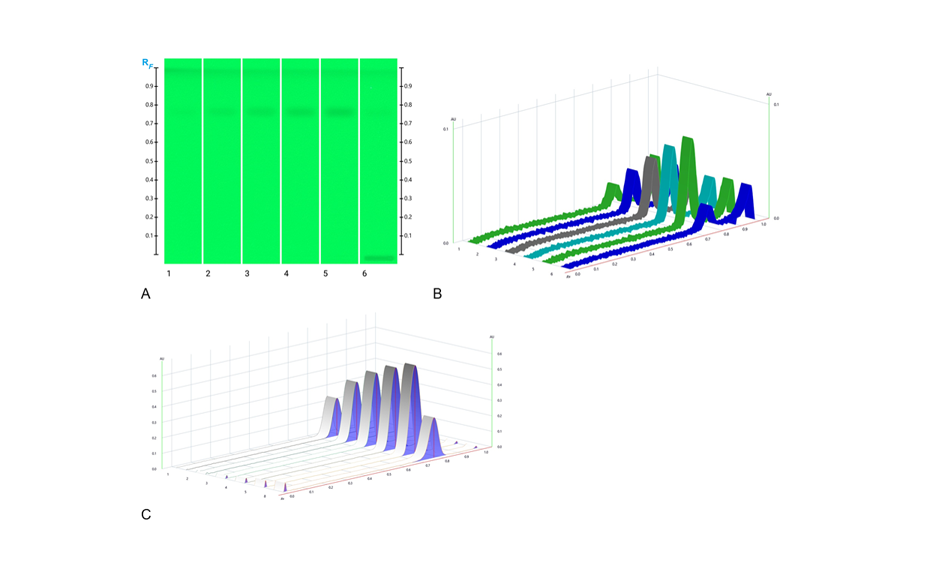
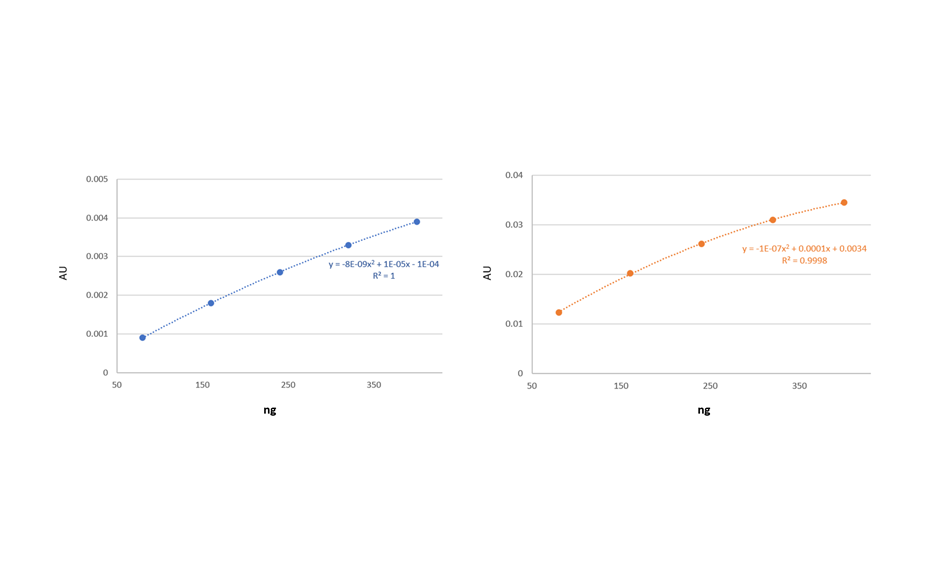
For quantification and to prepare the HMF standard curve, 1.0, 2.0, 3.0, 4.0 and 5.0 μL of the respective standard solution are applied. For the analysis of HMF in the honey samples, 10.0 μL of the respective honey solution is applied at a rate of 30.0 nL/s. After development, Peak Profiles from Images (PPI) obtained in UV 254 nm with the TLC Visualizer 2 are compared with Peak Profiles from Scanning Densitometry (PPSD) subsequently measured at 290 nm with the TLC Scanner 4.
Editor´s note: The response of HMF is higher for scanning densitometry compared to image-based evaluation; the working range can be adjusted to the linear working range by reducing the concentration of the sample and standard solutions.
The level of HMF in artificial honey was within the acceptable limit (80 mg/kg of honey) after 4 months of storage at 40 °C. The HMF limit exceeds the acceptable limit after 48 h for artificial honey stored at 60°C. For the honey stored at 80°C, the limit is exceeded already after 24 h of storage. This experiment shows that honeys need to be stored or temperature treated carefully to limit the formation of HMF.

HMF content in artificial honey stored at different temperatures over time
Conclusion
The HPTLC method for the detection and quantification of HMF in honey is easy to perform and offers a convenient quality control tool for the honeybee industry. It allows monitoring the HMF-related changes to the quality of honey during processing (especially temperature treatment) and storage. The absence of any sample pre-treatment steps and post-chromatographic derivatization, a neat solvent as developing solvent, and no chamber saturation and activation are major advantages. The method may also be used for the detection and quantification of HMF in other botanicals and foods with high sugar content.
[1] M. K. Islam et al. Foods (2021), 10(2), 357.
[2] M. K. Islam et al. Molecules (2022), 27(23), 8491.
[3] M. K. Islam et al. Molecules (2020) 25(22).
[4] E. S. Chernetsova, Anal Bioanal Chem (2011), 401(1), 325-332.
Further information is available on request from the authors.
Contact: Dr. Cornelia Locher, CRC for Honey Bee Products and Division of Pharmacy, School of Allied Health, University of Western Australia, Crawley, Western Australia, 6009, Australia, connie.locher@uwa.edu.au

