The research group "Nanosensors and Bioanalytical Systems" consists of researchers from the Spanish National Center for Scientific Research (CSIC, at the Instituto de Carboquímica) and the University of Zaragoza. One of the group’s areas of interest is the use of HPTLC-based techniques for analysis of complex mixtures mostly coming from petroleum conversion, biofuels and lipidomics. In addition to the inherent advantages of HPTLC (flexibility, complete sample detection, etc.), its coupling to any MS instrument through an elution-based interface opens up an unexplored range of analytical possibilities [1].
Introduction
Fabry disease is a severe genetic disease of lysosomal deposition produced by malfunction of an enzyme (α-galactosidase A), which results in a gradual accumulation of Gb3, among other metabolites, in body fluids.
A number of Gb3-related molecular species in the plasma of Fabry patients were detected at very low concentrations and demonstrated to be biomarkers, using reversed-phase LC coupled to mass spectrometry. HPTLC has generally not been considered as adequate for detailed characterization of a complex sample of lipids. This perception is not correct since currently HPTLC-MS is a methodology to get more information online in less time from complex biological matrices. HPTLC separation reduces mass spectral complexity, which, in turn, allows for a comprehensive examination of samples, even if incompletely resolved separations are obtained.
The objective of this work is to assess whether an HPTLC densitometry-MS approach using the TLC-MS Interface 2 is adequate to determine Fabry biomarkers related to Gb3 in human plasma.
A separation of a plasma extract into sphingolipid classes, followed by densitometry and MS coupling provides a simple but powerful approach for the detailed structural elucidation of sphingolipids present in human plasma, allowing their recognition by their m/z, and confirmation by their collision induced dissociation MS/MS data, and/or APCI fragmentation.
The TLC-MS Interface 2 is suitable for the analysis of sphingolipids and provides a rapid, precise, and targeted characterization of selected bands on the plate. In our approach we use ESI-MS and APCI-MS. Intensities of ESI(+)-MS ions can be related to the concentration of species.
Samples and Standard solutions
Plasma samples from a Fabry’s patient and a healthy control are obtained from the Institute of Health Sciences (Zaragoza, Spain) after approval of the Ethical Committee of Aragon (CEICA, Spain). Informed consent was obtained from the human subjects.
The investigated Gb3 are untargeted species and no standards are available. Solutions of standards of lyso-Gb3, Gb3, lactosylceramide (LacCer), glucosylceramide (GlcCer) which represent the main sphingolipid families are prepared at a final concentration of 0.1 μg/μL each in dichloromethane – methanol 1:1 (v/v).
Sample preparation
Neutral sphingolipid extracts are obtained from plasma using a standard sample preparation procedure which involves centrifugation (10 min at 5000 rpm) to remove precipitated protein, followed by alkaline hydrolysis (75 μL of 2M sodium hydroxide, incubated under magnetic stirring for 2 h at 40 °C), and liquid-liquid (H2O-methanol) extraction. The lower layer containing the neutral sphingolipids is then transferred to a vial and dried under N2. Samples are reconstituted in 250 μL of dichloromethane – methanol 1:1 (v/v).
Chromatogram layer
Two LiChrospher plates (20 x 10 cm, Merck) are used. They are pre-washed with methanol and kept in a desiccator in N2 atmosphere until use.
Sample application
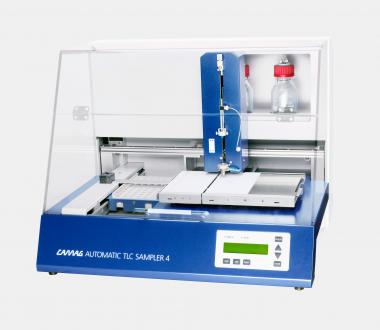
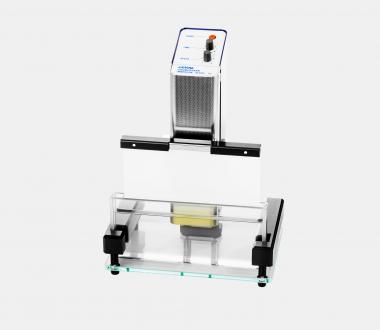
Sample and standard solutions are applied as 4 mm bands on the corresponding plate by using the Automatic TLC Sampler (ATS 4). Each of the plasma samples and standards are applied in triplicate. The distance between tracks is 10.6 mm, distances from the left and lower plate edges are 10 mm. One or more tracks are left empty, as blanks. Between 25.0–30.0 μL of plasma sample extracts and 0.1–10.0 μL of standard solutions are applied on the same plate.
Chromatography
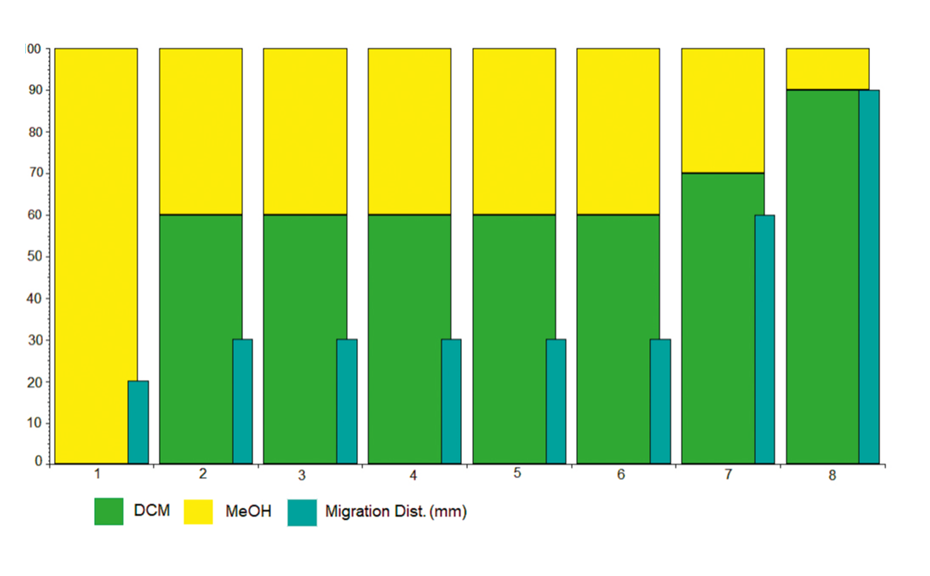
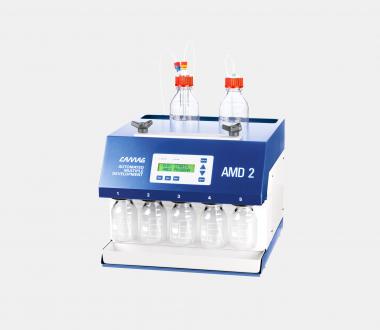
Development is performed on two twin plates using the Automated Multiple Development (AMD 2) system under the conditions in figure 1.
Post-chromatographic derivatization
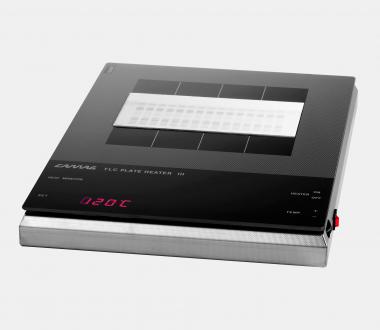
One of the twin plates is immersed into 0.2g of orcinol in 100 mL of 10%H2SO4 using the Chromatogram Immersion Device (immersion time: 2 s). The plate is heated during 15 min at 100 °C using the TLC Plate Heater 3.
Densitometry
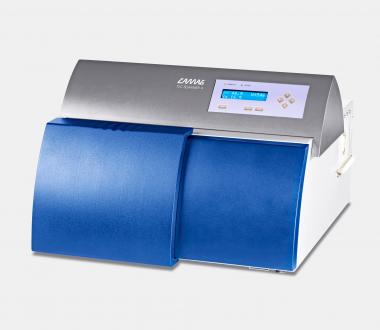
Absorbance measurement is performed with the non-derivatized plate at 190 nm and with the derivatized plate at 550 nm using the TLC Scanner 3.
Mass spectrometry
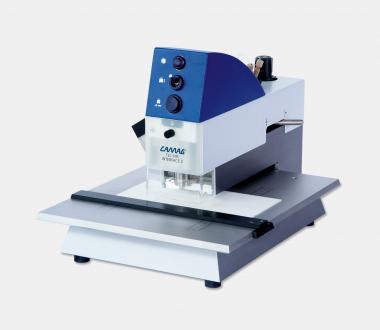
Selected zones of the non-derivatized plate are eluted with the TLC-MS Interface 2 (oval head) at a flow rate of 0.2 mL/min with methanol into an ion-trap MS with ESI(+) ionization. Gb3 species with m/z between 1000 and 1200 Da are scanned. HPTLC-ESI(+)-MS/MS is used for structure identification. Alternatively, APCI(+) ionization is used for structure confirmation by an analysis of derived fragments with m/z <1000.
Results and discussion
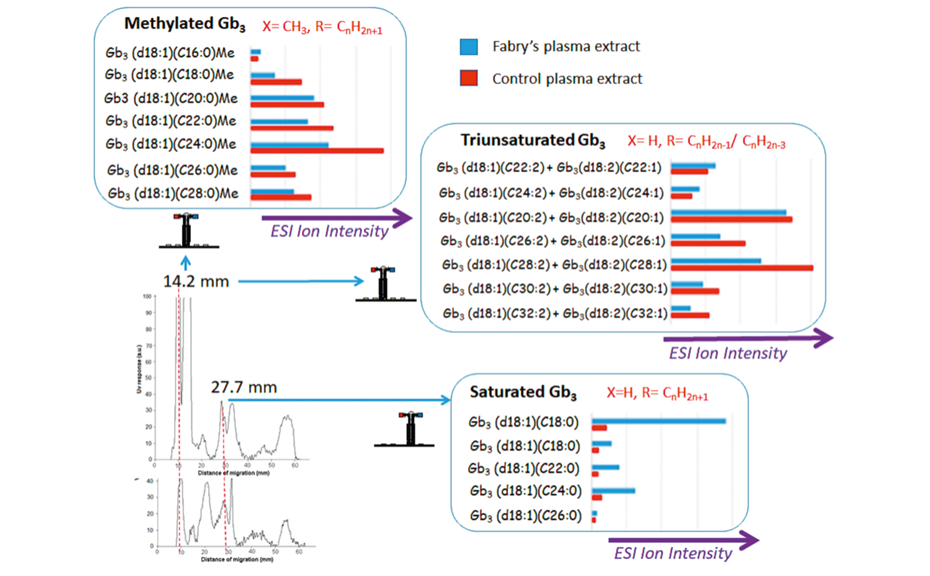
Identification and semi-quantification of 19 untargeted molecular species of globotriaosyl-ceramides (Gb3) in extracts from a Fabry’s plasma patient and a healthy control was performed by HPTLC densitometry-MS. The species found were: five isoforms of saturated Gb3, seven isoforms of methylated Gb3, and seven species with three unsaturations (that of sphingosine plus two additional unsaturations). Twelve of these species were previously reported as biomarkers of Fabry’s lysosomal disorder using a LC-MS-based method, and the other seven are structurally similar, closely related to them [2].
Saturated Gb3 isoforms come from the ESI(+)-MS analysis of the peak at 27.7 mm of Fabry extract (and 27.9 mm in the case of control). This is the migration distance of the Gb3 standard. Ions are mostly detected as sodium adducts. The most preponderant isoform is d18:1;C16:0 (m/z 1046.8 [M+Na]+). Confirmation of identity of this most abundant ion [C52H97NO18Na]+ is done by ESI-MS/MS by loss of a hexose group, giving a product ion at m/z 885.2.
Methylated and three-unsaturated Gb3 species were both found in HPTLC-UV peaks at 14.9 (Fabry) and 14.2 mm (control). They should have a priori corresponded to preponderant sphingomyelin (SM) species. The obtained HPTLC-ESI(+)-MS showed intensities of 105 arbitrary units (a.u.), and high S/N ratio for SM species. However, we found that some Gb3-related species are present in low concentration and can co-migrate together with the above SM species. Intensities for these Gb3 species are 104 a.u. (arbitrary units). The zone between m/z 1000-1300 displays ESI ions that matched with either methylated Gb3-related isoforms as [M+Na]+, or Gb3-related isoforms or analogues with three unsaturations, as [M+H]+. The presence of these structures found by ESI-MS was verified by an analysis of lowmolecular ion fragments obtained using HPTLC-APCI(+)- MS [2]. This experiment was performed in duplicate and similar spectra were obtained in each case.
Ion intensities are related to concentration of Gb3 species for several reasons summarized elsewhere [2]. Saturated Gb3 in Fabry’s plasma were in higher concentration than in control sample in repeated experiments. ESI-MS profiles for methylated and unsaturated Gb3 species were qualitatively similar for Fabry and control samples although relative distribution of ions is different.
Conclusion
HPTLC-MS has been proven to be a simple but powerful approach for the detailed structural elucidation of sphingolipids present in human plasma. The potential of HPTLC-MS for lipidomic research in general has been summarized elsewhere [1].
[1] V.L. Cebolla et al. J Liq Chromatogr & Rel Technol (2021) https://doi.org/10.1080/10826076.2020.1866600
[2] C. Jarne et al. J Chromatogr A 1638 (2021) 461895
Further information is available on request from the authors.
Contact: Dr. Vicente L. Cebolla, Instituto de Carboquímica, CSIC, Miguel Luesma Castán, 4. 50018 Zaragoza, Spain, vcebolla@icb.csic.es
Mentioned Products
The following instruments and devices were used in this work
