Introduction
Honey is one of the most frequently tested natural food products. In recent years, Manuka honey has gained popularity because of its high antibacterial activity [1]. Methylglyoxal (MGO) was identified as one of the major contributors to its antibacterial property. MGO is present in high concentrations in manuka honey and is directly responsible for its potency. This makes the Manuka honey exclusive and high-priced as compared to the other traditional kinds of honey. Manuka honey from New Zealand usually contains 40 to 800 mg/kg of MGO but can even contain up to 1900 mg/kg [2]. To avoid adulteration of Manuka honey products, a strict quality regulation regarding its origin, purity, and quality needs to be fulfilled and is a prerequisite for the UMF™ (Unique Manuka Factor) grading [2]. It mostly reflects the MGO amount in the honey but also considers other authenticity markers.
In the following application, we focus on the MGO quantification using HPTLC with subsequent substance confirmation by MS measurement. The high viscosity and high sugar content of honey make it a very complex and matrix-rich sample to analyze. HPTLC is a convenient, fast, and efficient separation technique that enables the development of analytical methods without the need for complicated sample preparations or high investments [3]. Low cost and short analysis time per sample are given by the parallel analysis of many samples on one plate. Furthermore, the high matrix tolerance of HPTLC offers additional opportunities to existing routine methods.
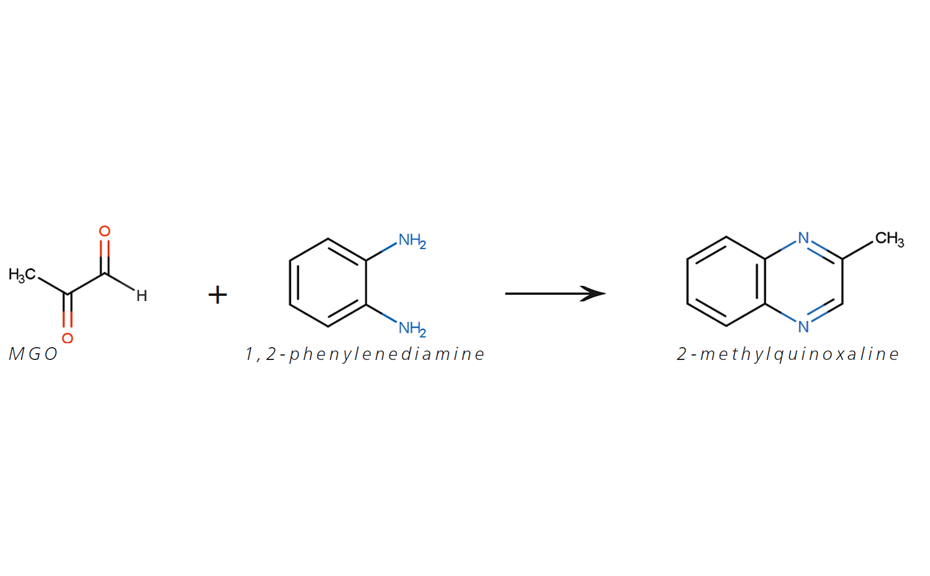
Six different commercially available Manuka honey samples were analyzed. MGO shows a mesomeric effect and reacts immediately with water to form either methylglyoxal monohydrate or methylglyoxal dihydrate [4]. Only a small amount of around 1% MGO remains unreacted. Direct detection of MGO in Manuka honey is difficult with conventional methods. In this application, MGO is converted to the stable 2-methylquinoxaline by derivatization with 1,2-phenylenediamine [5]. The stable form is then used as the reference. For confirmation of the method and determination of the recovery rate, regular honey samples were spiked with MGO and 1,2-phenylenediamine. Other derivatization options were tested but the reaction with 1,2-phenylenediamine performed best. Water and honey matrix were tested, to confirm that the optimized reaction conditions provide reproducible results for both matrices.
Standard solutions
The standards are prepared by dissolving 100 μL of Sigma-Aldrich ~40% aqueous MGO solution (exact content known from batch specification) in 20.0 mL of water. 800 μL of the stock solution is further diluted with water to 10.0 mL and 0.2% (2 mg/mL) of the reactant Supelco 1,2-phenylenediamine powder is added. All standard solutions are stored at 8°C for two days before use to achieve reproducible reaction of MGO with 1,2-phenylendiamine. Longer storage time (>3 days) leads to partial degradation of 2-methylquinoxaline.
Sample preparation
Honey samples are prepared at 100–150 mg/mL (in the shown examples: honey sample solutions of 100 mg/mL in case of sample numbers 1, 3, 5, and 150 mg/mL in case of honey samples 2, 4 and 6 were applied in a higher volume due to the expected lower amount of MGO). To each sample 0.2% of 1,2-phenylenediamine is added, e.g., sample 1, 4.0 g honey diluted in 40 mL solution of water /ethanol in 3:2. To the solution, 0.2% (2 mg/mL) of the reactant 1,2-phenylenediamine is added. Before using the samples, they need to be stored at 8°C for two days to complete the reaction.
Chromatogram layer
Supelco HPTLC silica gel 60 F254 20 x 10 cm are used. The plates are pre-washed with the developing solvent (up to 70 mm) and dried before use.
Sample application
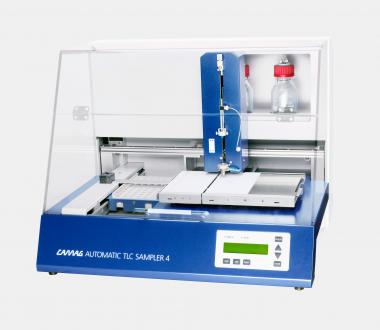
Between 0.3–9.0 μL of the samples and standard solutions are applied as areas 5 x 3 mm [2] with the ATS 4 (y = 10 mm, x = 15 mm). This step is necessary because of the high matrix and high application volumes of the honey samples.
Chromatography
After drying, the plate is developed in a Twin Trough Chamber (20 x 10 cm, both troughs filled, 15 minutes waiting time before use, without filter paper) with ethyl acetate – acetonitrile 85:15 (V/V) to the migration distance of 50 mm (from the lower edge), followed by drying for 5 min at 60°C with a plate heater.
Post-chromatographic derivatization
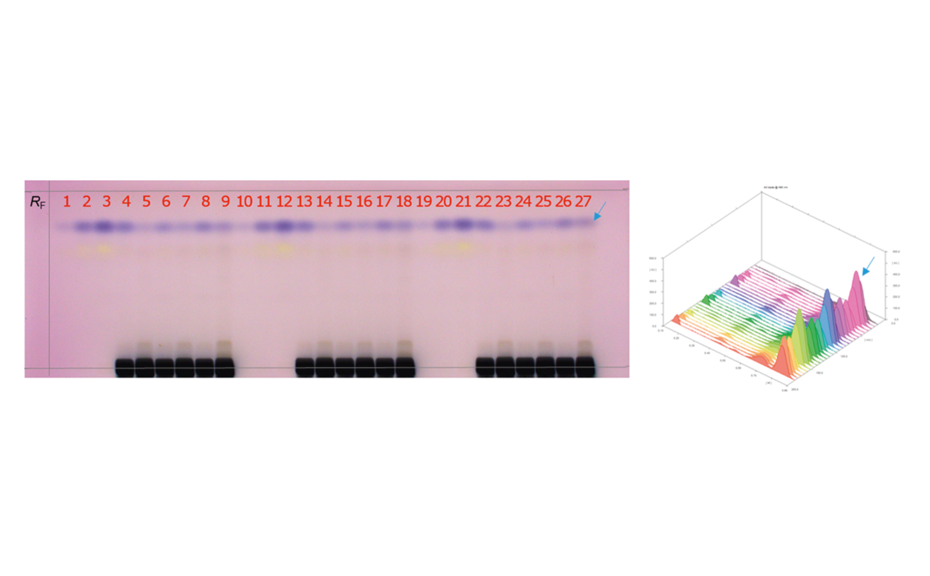
After development, the plate is dried and then derivatized by dipping in an anisaldehyde-sulfuric acid reagent (0.5 mL p-anisaldehyde, 85 mL methanol, 10 mL glacial acetic acid, 5 mL sulfuric acid 98%). Blue zones of 2-methylquinoxaline (product of the reaction ofMGOwith 1,2-phenylenediamine) appear at RF 0.8. The yellow zone at RF 0.7 is unreacted 1,2-phenylendiamine.
Documentation
Images of the plate are captured with the TLC Visualizer in white light.
Densitometry
Absorbance measurement at 480 nm is performed with CAMAG TLC Scanner 3 (slit dimension: 2.00 x 0.20 mm, scanning speed: 20 mm/s, data resolution: 100 μm/step).
Mass spectrometry
The target zones are marked in UV light 254 nm. Afterwards, they are directly eluted from the plate with acetonitrile – water – formic acid 95:5:0.1 (V/V) and an MS-Interface, and measured with a single quadrupole MS.
Results and discussion
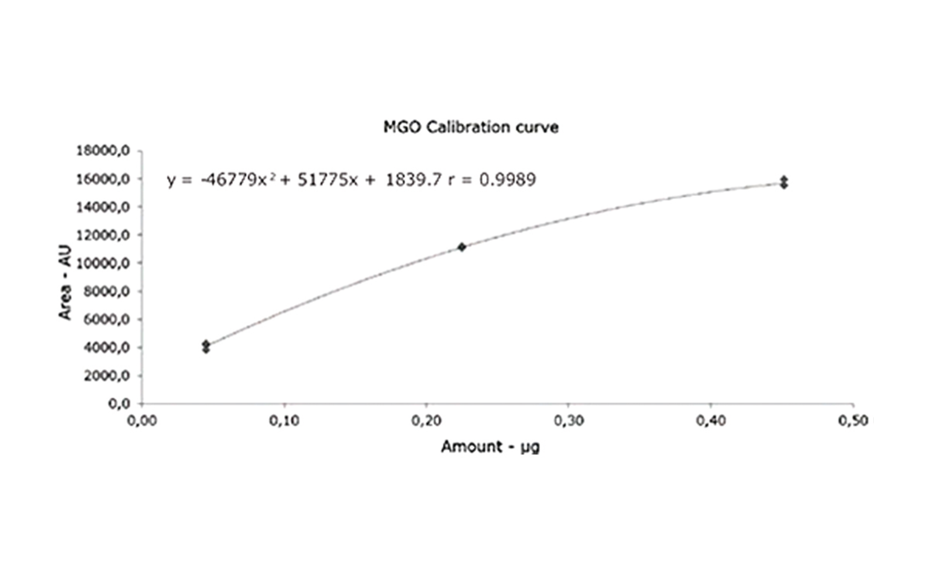
As demonstrated, MGO can be identified and quantified in different honey samples within the concentration range of 50 to 600 mg/kg. The conversion of MGO into the more stable compound 2-methylquinoxaline allows for an easy evaluation of theMGO content. A recovery study was performed using regular honey to simulate the honey matrix. It was spiked with a known amount of MGO standard solution, followed by the addition of 1,2-phenylenediamine. The measured (and calculated) MGO amount allowed for the correlation of the actual amount of MGO in the Manuka honey samples. The recovery study showed a detectable MGO amount of around 90%. The correlated MGO amount in Manuka samples was calculated accordingly. One of the samples (sample 1) showed a lower MGO content than indicated by the supplier. This might be because of the degradation of the MGO during storage. Samples 2 and 6 only showed MGO concentrations of 50 and 100 mg/kg. These Manuka honey samples are considered of lower quality; although no MGO concentration was provided by the supplier.
In summary, the analysis of MGO in a complex and challenging food matrix like honey was described. The target analyte could be easily separated and detected without time-consuming and laborintensive sample preparation. The flexible set-up enabled a combination with MS measurements. Screening and method development capabilities were shown by the application of 27 tracks on one plate. The study clearly differentiated various honey qualities (referring toMGO content) on the market. Though the analysis of MGO is challenging, MGO content could be well quantified in the expected range. A fast, cheap, and simple quantification of MGO can be accomplished with HPTLC.
[1] E. Mavric, et al. (2008) Mol Nutr Food Res
[2] https://newzealandhoneyco.com/pages/mgo-vs-umfcalculator- manuka-honey
[3] M. Schulz et al. (2009) Analytix Reporter, Issue 5
[4] https://magritek.com/2021/01/29/identification-andquantification- of-methylglyoxal-in-manuka-honey/
[5] E. Dimitrova (2013), Master thesis, TU University of Graz, Austria
[6] Merck (unpublished results)
Further information is available on request from the authors.
Contact: Dr. Monika Bäumle, Global Product Manager TLC, Merck, monika.baeumle@merckgroup.com.
The life science business of Merck KGaA, Darmstadt, Germany operates as MilliporeSigma in the U.S. and Canada.
Mentioned Products
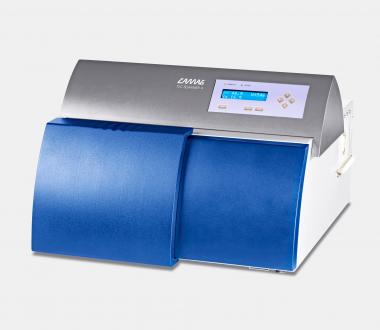
The following instruments and devices were used in this work (discontinued products are replaced with current versions)
![Mass spectra of 2-methylquinoxaline (m/z = 145.0 [M+H+] and 186.0 [M+ACN+H+]) and 1,2-phenylendiamin (m/z = 150.0 [M+ACN+H+]) Mass spectra of 2-methylquinoxaline (m/z = 145.0 [M+H+] and 186.0 [M+ACN+H+]) and 1,2-phenylendiamin (m/z = 150.0 [M+ACN+H+])](/sites/default/files/styles/image_slider/public/2022-04/CBS%20128_Quantification%20of%20methylglyoxal%20in%20Manuka%20honey%20%E2%80%93%20A%20simple%20HPTLC%20based%20approach_.png?itok=AERgUCct)
