Introduction
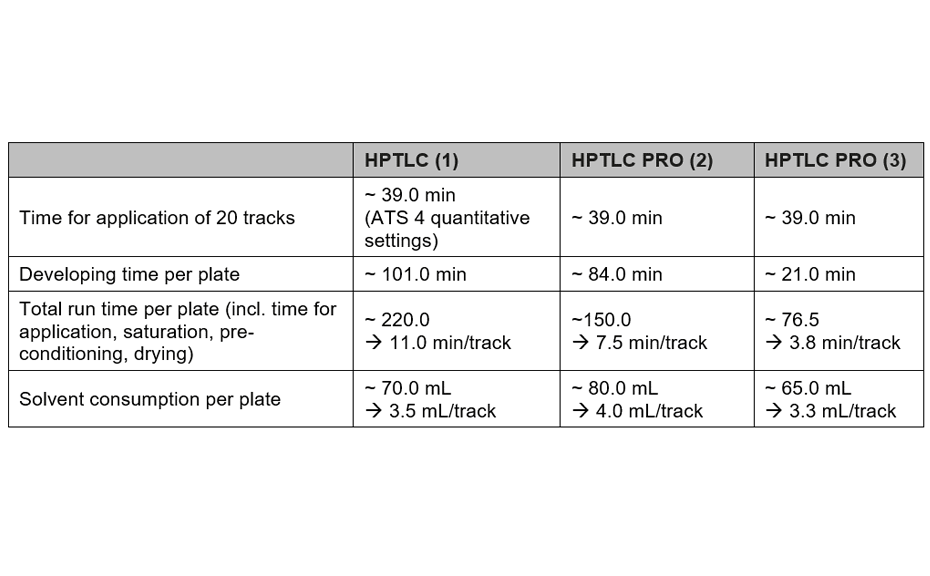
The quantification of simple sugars can be challenging due to their high polarity, low volatility, their lack of a chromophore and their common occurrence in complex matrices [1–3]. HPTLC can separate mono- and oligosaccharides after minimal sample preparation and can sensitively detect these compounds after post-chromatographic derivatization. The published method for quantification of sugars in honey [2] allows analyzing multiple samples on a single plate within approximately 3.7 hours. With the method transferred to the new HPTLC PRO System, this test can be accomplished in about 2.5 hours. An alternative method developed for HPTLC PRO requires just 1.3 hours per plate.
HPTLC allows quantification of sugars in honey and other complex matrices at low running costs. Depending on the level of equipment used, the speed, automation and reliability of the obtained quantitative results can be increased. With the new method developed for the HPTLC PRO System, the main sugars in honey can be investigated in short time and other sugars, such as oligomers present in fermentation processes, can be analyzed at the same time.
Standard solutions
Individual sugars are dissolved in 50% aqueous acetonitrile with sonication to obtain a final concentration of 1.0 mg/mL for qualitative tests, method transfer and method development. For quantification and during determination of the working range, a mixture of fructose, maltose, sucrose, and glucose at concentration levels between 12.5 μg/mL–1000.0 μg/mL is used in 50% aqueous acetonitrile.
Sample preparation
The samples are dissolved in 50% aqueous acetonitrile with sonication to obtain a final concentration of 1.0mg/mL for qualitative tests and are applied in 20-fold dilution for quantification of the two main sugars in honey (fructose, glucose).
Chromatogram layer
HPTLC plates silica gel 60 F254 (Merck), 20 x10 cm are used.
Sample application
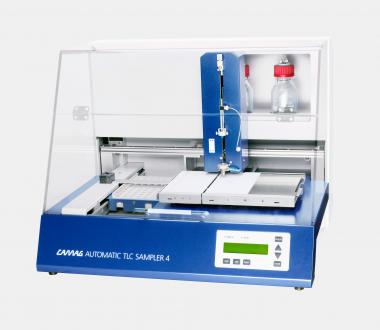
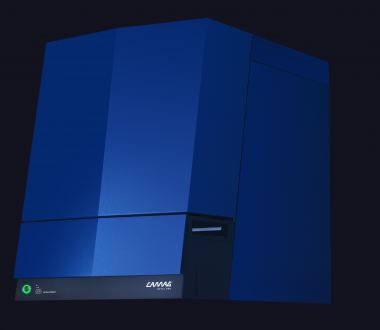
Samples and standard solutions are applied as bands with the Automatic TLC Sampler (ATS 4, quantitative settings, 10 μL syringe) or the HPTLC PRO Module APPLICATION using the default settings (two rinsing solutions), 20 tracks, band length 6.0 mm, distance from left edge 18.0 mm, track distance 8.5 mm, distance from lower edge 8.0 mm. 1.0–3.0 μL for sample solutions and 1.0 μL for standard solutions are applied.
Chromatography
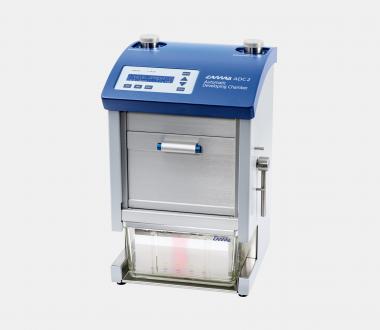
(1) Plates are developed in the ADC 2 with chamber saturation (with filter paper, 60 min), after activation at 33% relative humidity (*) for 10 min using a saturated solution of magnesium chloride, followed by 5 min pre-conditioning, development with n-butanol – isopropanol – aqueous boric acid (5 mg/mL) 3:5:1 (V/V) to the developing distance of 85 mm (from the lower edge), followed by drying for 15 min** [2]. (2) Plates are developed in the HPTLC PRO Module DEVELOPMENT after activation at 0% relative humidity (*molecular sieve) for 10 min, followed by 90 s pre-conditioning at 30% pump power, development with n-butanol – isopropanol – aqueous boric acid (5 mg/mL) 3:5:1 (V/V) to the developing distance of 70 mm (from the lower edge), followed by drying for 15 min. (3) Plates are developed in the HPTLC PRO Module DEVELOPMENT after activation at 0% relative humidity (molecular sieve) for 10 min, development with ethyl acetate – methanol – boric acid (5 mg/mL) – acetic acid 50:40:10:2 (V/V) to the developing distance of 70 mm (from the lower edge), followed by drying for 5 min.
Note: *methods (1) and (2) are very robust and no significant differences for the RFvalues were obtained between 0 and 33% relative humidity; **deviation from [2]
Post-chromatographic derivatization
Aniline-diphenylamine-phosphoric acid reagent (ADPA reagent): 2.0 g of diphenylamine and 2.0 mL of aniline are dissolved in 80.0 mL of methanol, 10.0 mL of o-phosphoric acid (85%) are added and the mixture is shaked until any precipitate is dissolved, then again 10.0 mL of methanol are added. The plate is sprayed with the Derivatizer (yellow nozzle, spraying level 6), heated at 110°C for 10 min on the TLC Plate Heater.
Documentation
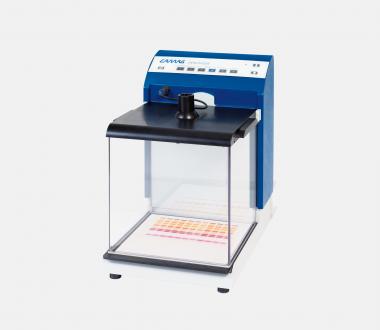
Images of the plate are captured with the TLC Visualizer 2 at UV 366 nm and white light after derivatization.
Densitometry
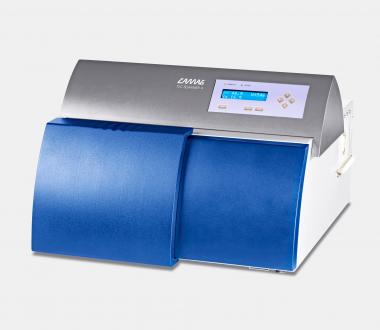
Absorbance measurement at 370 nm [3] is performed with TLC Scanner 4 and visionCATS 3.0 (slit dimension 5.00 mm x 0.30 mm, scanning speed 50 mm/s, data resolution 25 μm/step for single-wavelength scan, spectra recording from 350–800 nm).
Results and discussion
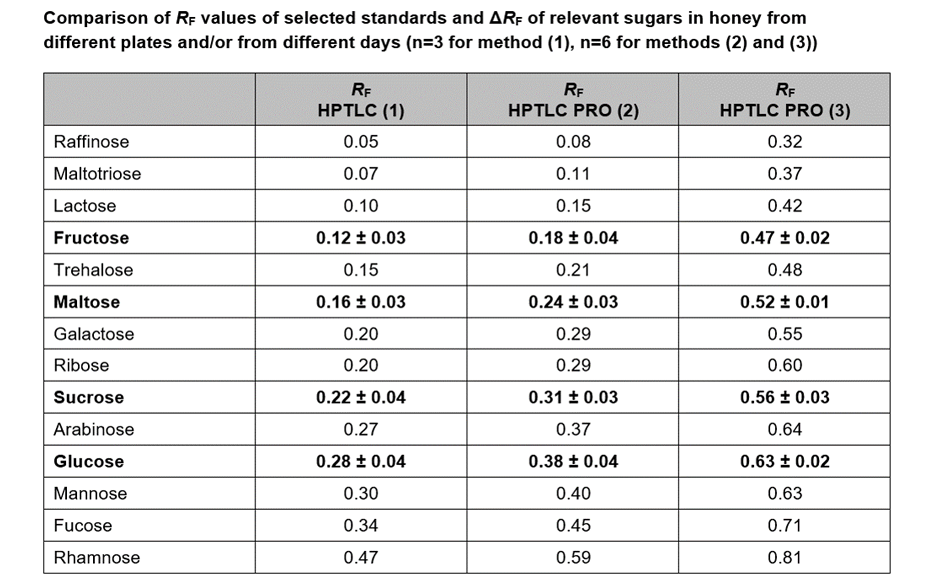
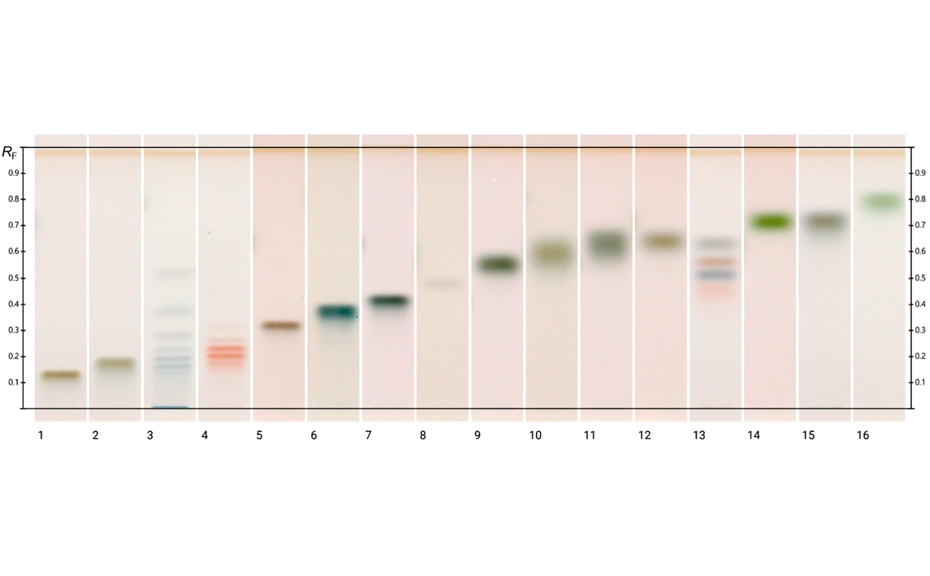
The methods have been compared for their consumption of time and consumables, and their repeatability: method (1) with the conditions from [2] by using the ATS 4 and ADC 2, method (2) with the developing solvent from [2] by using the HPTLC PRO Modules APPLICATION and DEVELOPMENT, and method (3) with an alternative developing solvent by using the HPTLC PRO Modules APPLICATION and DEVELOPMENT. All three methods are well suited for quality control of honeys.
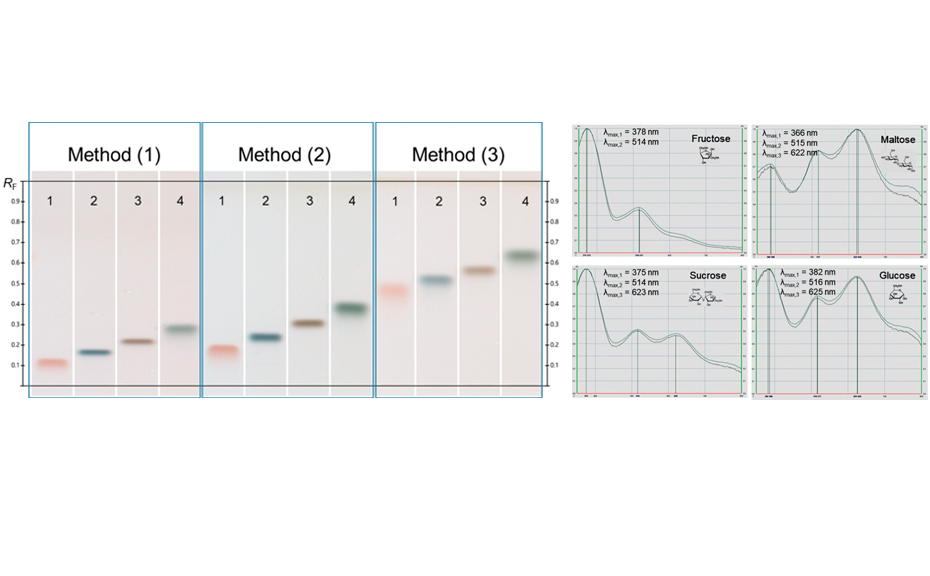
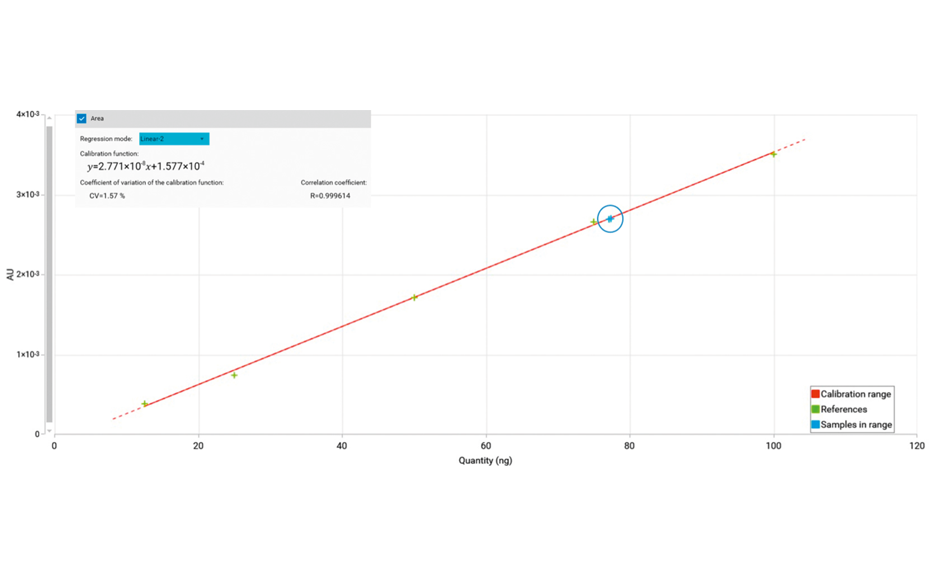
The UV/VIS spectra recorded after derivatization show a high signal response for all analytes at 370 nm. Therefore, LODs/LOQs have been determined for the four relevant sugars in honey at this wavelength to facilitate evaluation in routine quality control by using scanning densitometry at a single wavelength (LOD370 nm/LOQ370 nm for fructose and sucrose: 6.0/18.0 ng/zone, for maltose and glucose: 12.0/48.0 ng/zone). The linear working range extends from LOQ370 nm to 125.0 ng/zone.
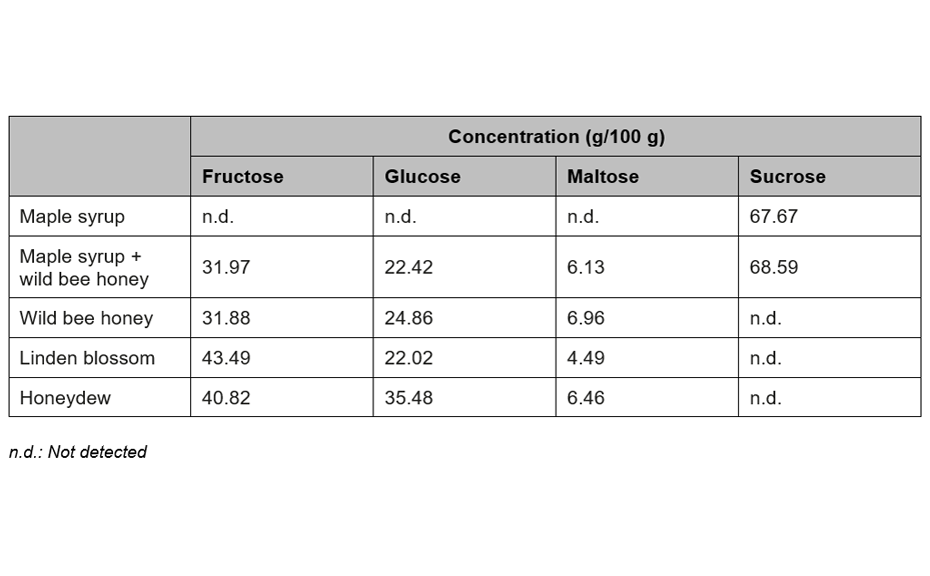
For the quantification of fructose, maltose, sucrose, and glucose, method (2) is recommended. In this case, the best separation of the four analytes in an optimum RF range is achieved in significantly less run time compared to method (1). To proof the suitability of the method (2) for quantification, four samples of honey have been selected of which one was mixed with maple syrup 1:1 to determine the recovery. The results are listed in Table 2.
Method (3) is best suited for the analysis of sugars of different sizes (mono- and oligomers) and sugar acids of high polarity (e.g. glucuronic acid). The entire migration distance is used for separation whereas methods (1) and (2) are optimized for the separation and quantification of mono- and dimers.
Conclusion
With the three methods described herein, the principal sugars of honey can be analyzed at low running costs. The instrument investment costs for method (1) are lower, but more time and manual intervention is required for each analysis. Methods (2) and (3) have been developed for routine quality control and a high sample throughput. In this case, the level of automation and reduced time per sample are of greater importance, making the HPTLC PRO System the better choice. Method (3) can be used for sugar analysis in general, e.g. for optimization and monitoring of fermentation processes and for analysis of sugar containing products in divers matrices.
[1] M. K. Islam et al. J Planar Chromatogr (2020) 33(5):489–499
[2] M. K. Islam et al. Molecules (2020) 25(22)
[3] G.E. Morlock, G. Sabir, J Liquid Chromatogr (2011) 34:902–919
Further information is available on request from the authors.
Contact: Dr. Melanie Broszat, CAMAG, Sonnenmattstrasse 11, 4132 Muttenz, Switzerland, melanie.broszat@camag.com
Mentioned Products
The following instruments and devices were used in this work
