Corinna Henninger is a Ph.D. student at the Karlsruhe Institute of Technology, under supervision of Adj. Prof. Katrin Ochsenreither. Her research focuses on the enzyme class of phytases, the analysis of the obtained degradation products, and the design of novel phytases using molecular biology. Her work is conducted at the Offenburg University of Applied Sciences, under co-supervision of Prof. Thomas Eisele, an expert in the field of enzyme production.
Introduction
Phytases (IUBMB Enzyme Nomenclature: EC: 3.1.3.26) catalyze the stepwise dephosphorylation of phytate (myo-inositol-1,2,3,4,5,6-hexakisphosphate or InsP6), the natural storage component of phosphate in plants. However, phytate shows poor digestibility in non-ruminant animals such as swine, poultry and fish due to their lack or low activity of InsP6-hydrolyzing enzymes in the gastrointestinal tract. Therefore, phytases are utilized as a feed additive to release the bound phosphate. The analysis of myo-inositol phosphates (InsPx) is challenging and time consuming, particularly in terms of separation and detection. However, when dealing with a large number of samples in the screening for phytases during protein engineering, having a fast and robust analysis method is crucial to reliably identify promising novel enzymes or target variants.
Considering high sample throughput and separation of all isomeric pools as well as free phosphate, HPTLC is most suitable as a fast and inexpensive screening method. Furthermore, the utilization of an enzyme assisted post-chromatographic derivatization step makes the method highly specific for InsPx.
Standard solutions
1.0 g/L phosphate (Pi, TraceCERT® for IC) in water is utilized. Inositol phosphates Ins(3)P1 (sodium salt), Ins(2,4)P2 (sodium salt), Ins(1,4,5)P3 (sodium salt), Ins(2,3,5,6)P4 (sodium salt), Ins(1,3,4,5,6)P5 (sodium salt) Ins(1,2,3,4,5,6)P6 (sodium salt) are dissolved in water.
Sample preparation
Phytic acid (1.66 g/L in 50 mM NaOAc pH 5.5 and 3.6) are digested enzymatically using 10 U/L phytase activity at 37 °C for 24 h. Samples are taken periodically (after 5, 30, 60, 120, 180, 240, 300 min and 24 h) and stopped by heat.
Chromatogram layer
HPTLC Cellulose F (Merck), 20 x 10 cm and 10 x 10 cm are used.
Sample application
2.0 μL of sample solutions and 2.0–19.0 μL of standard solutions are applied as bands with the Automatic TLC Sampler (ATS 4), 20 tracks, band length 6.0 mm, distance from the left edge 15 mm, track distance 10 mm, distance from the lower edge 10 mm.
Chromatography
Plates are developed in a twin through chamber after chamber saturation for 30 min with 20 mM NaOAc – 10mM NH4Cl – 2-propanol – 1,4-dioxane – acetic acid 500:520:200:6 (V/V) up to 75 mm (from the lower edge), followed by drying overnight (minimum 12 h) at 105 °C.
Post-chromatographic derivatization
- Enzymatic digest: Still warm plates are sprayed with 1 mL of enzyme solution (250-fold diluted Quantum® Blueliquid 5G in 50 mM NaOAc pH 4.5) using the Derivatizer (pre-cleaned with water). After spraying, the plate is pre-incubated at ambient temperature for 5 min and then transferred to a TLC Plate Heater at 55 °C for 15 min.
- Molybdate reagent: Plates are sprayed with 0.5 mL of molybdate reagent (5 mL of a 10 g/L ammonium molybdate heptahydrate aq. solution mixed with 200 μL of concentrated sulfuric acid freshly prepared every day) using the Derivatizer. Subsequently the plates are treated with UV light at 254 nm for 15 min.
Documentation
Images of the plate are captured with the TLC Visualizer in white light.
Densitometry
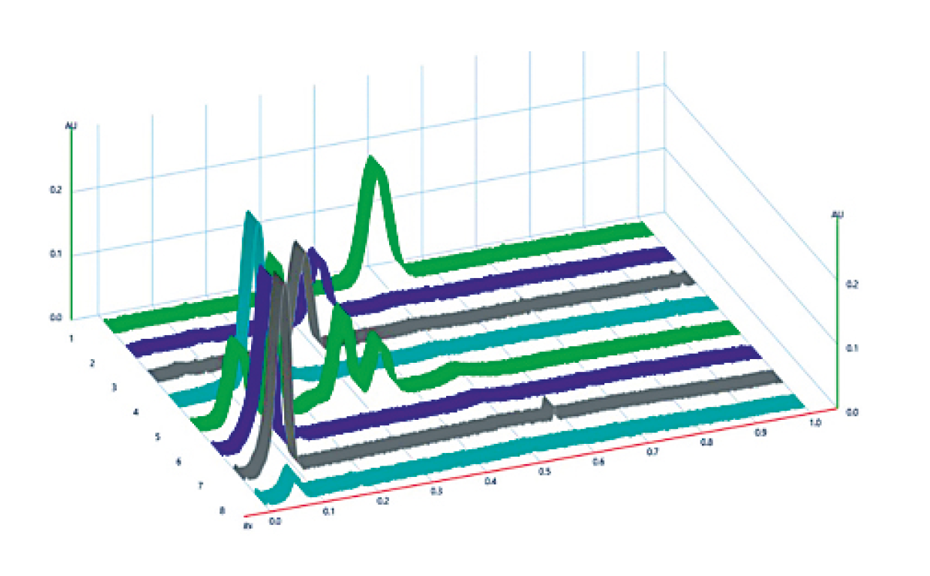
Absorbance measurement is performed with a DAD scanner [1] and with the TLC Scanner 4 at 774 nm, with a scanning speed of 5 mm/s, a data resolution of 25 μm/step, slit dimension 5.0 mm x 0.3 mm, spectra recording from 200 to 800 nm.
Results and discussion
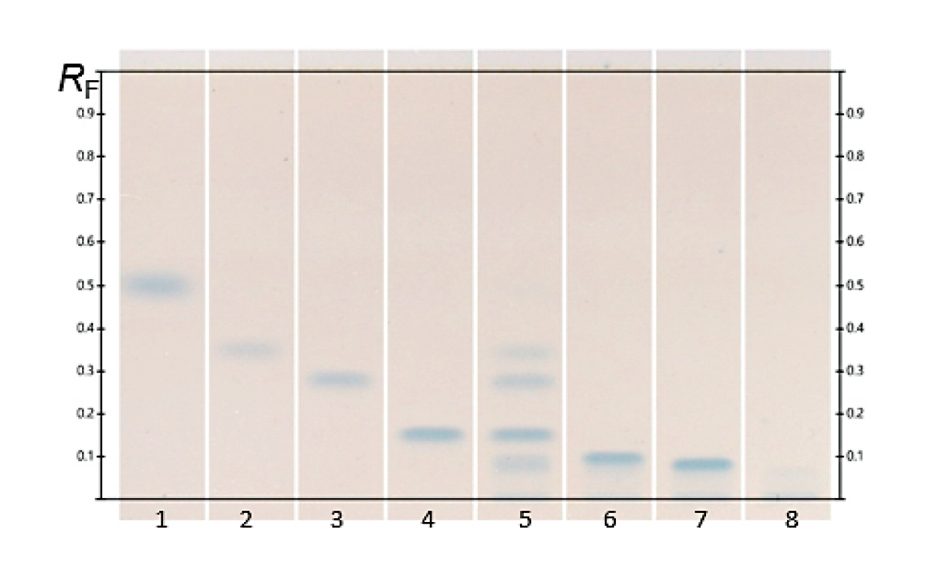
This HPTLC method is suitable for the separation of InsPx pools as well as Pi. The isomers Ins(3)P1, Ins(2,4)P2, Ins(1,4,5)P3 and free phosphate are baseline separated. Ins(2,3,5,6)P4 and Ins(1,3, 4,5,6)P5 may be quantified by the peak splitting method. InsP6 (track 8) shows two bands in a concentration-dependent manner. Presumably, the part that is present as an undissolved salt remains on the application line, while the free base migrates to an RF value of 0.06 and thus comigrates with Ins(1,3,4,5,6)P5 (RF = 0.07).
Acidic conditions or salt containing samples may affect RF values, however not the overall separation of inositol phosphates. The quantification of the InsPx isomers can be performed by external standards and linear regression. For free phosphate, two linear ranges were found between 5–15 ng and 20–150 ng with correlation coefficients of 0.99 ([1] by using the Kubelka-Munk equation). Free phosphate was detected with a LOD and LOQ of 5.7 and 6.9 ng respectively.
The method is utilized to study the InsPx fingerprint of a phytase to evaluate its ability of phytic acid degradation. Our results show that the HPTLC is suitable for a rapid screening of inositol phosphates with a semi-high sample throughput. Accumulation of isomers can be detected as well as a quantitative phosphate release. The presented method is a useful tool for a fast, visual evaluation of novel phytases.
[1] C. Henninger et al., J Sci Food Agric. (2023), https://doi.org/10.1002/jsf2.109.
Further information is available on request from the author.
Contact: Corinna Henninger, Offenburg University of Applied Sciences, Badstrasse 24, 77652 Offenburg, Germany, corinna.henninger@hs-offenburg.de


![HPTLC fingerprints of InsPx (10 U*L-1, 37 °C) of the phytase Quantum® Blue at pH 3.6 (tracks 1–8) and pH 5.5 (tracks 11–18) at the time points 5, 30, 60, 120, 180, 240, 300 min and 24 h in ascending order; Image from [1] (https://creativecommons.org/licenses/by/4.0/legalcode). HPTLC fingerprints of InsPx (10 U*L-1, 37 °C) of the phytase Quantum® Blue at pH 3.6 (tracks 1–8) and pH 5.5 (tracks 11–18) at the time points 5, 30, 60, 120, 180, 240, 300 min and 24 h in ascending order; Image from [1] (https://creativecommons.org/licenses/by/4.0/legalcode).](/sites/default/files/styles/image_slider/public/2023-11/CBS131_Inositol_phosphate_analysis_by_HPTLC_img3.png?itok=iVw0vq-Z)