Introduction
Contamination of food with mineral oil products is of significant concern to food safety. Mineral oils can enter food either intentionally or unintentionally as contaminants. Mineral oils, known as MOH (mineral oil hydrocarbons) are intricate mixtures of hydrocarbons obtained from crude oil. They are divided into two fractions: 1. mineral oil aromatic hydrocarbons (MOAH), and 2. paraffin oil, also known as mineral oil saturated hydrocarbons (MOSH). MOSH consist of straight and branched open-chain alkanes (paraffins) and alkylated cycloalkanes (naphthenes). The diverse nature of these compounds presents a substantial challenge for analytical methods. For companies involved in milk processing, particular attention is given to detecting milk batches that might be contaminated with paraffin oil.
The screening method employed for this purpose needs to be as straightforward and rapid as possible. HPTLC, due to its ability to simultaneously separate multiple samples, is a suitable technique to fulfill these requirements.
The procedure described here involves isolating non-polar components from milk through liquidliquid extraction. Following the approach of Wagner and Oellig [1], the MOSH fraction is subsequently separated and identified on the HPTLC plate using primuline as derivatization step. This method can detect 5.0 μg/mL of paraffin oil in milk.
Standard solution
To avoid the possibility of contamination from leaching processes, only glass laboratory equipment is utilized for preparation of standards and samples. During method development, technical grade paraffin oil was diluted with toluene to a concentration of 10.0 mg/mL.
Sample preparation
For calibration and repeatability, 2.0 mL of each milk sample containing 3.9% milk fat is pipetted into glass centrifuge tubes using a volumetric glass pipette. These samples are spiked with the 10.0 mg/mL standard solution using a 10.0 μL glass syringe. The sample is acidified with 0.4 mL of formic acid (≥98%). After adding 3.0 mL of tert-butyl methyl ether and vortexing for 30 s, the sample is centrifuged for 5min with 2790 x g. The organic supernatant is transferred into a glass vial and used as test solution.
Chromatogram layer
HPTLC plates silica gel 60 F254 (Supelco), 20 x 10 cm are used after pre-washing with cyclohexane up to 50 mm and drying for 30 min at 100 °C.
Impregnation
Prior to sample application, HPTLC plates are impregnated with primuline solution (75 mg/L in methanol) using the Chromatogram Immersion Device 3 (time 20 s, speed 1), and dried using the TLC Plate Heater at 100 °C for 30 min.
Sample application
6.0 μL of sample and standard solutions are applied as bands with the HPTLC PRO Module APPLICATION, band length 6.0 mm, distance from the left edge 18.0 mm, track distance 8.5 mm, distance from the lower edge 8.0 mm. The first rinsing step (solvent bottle 1) is performed with methanol – acetonitrile – isopropanol – water – formic acid 250:250:250:250:1 (V/V) and the second rinsing step (solvent bottle 2) with methanol – water 7:3 (V/V).
Chromatography
In the HPTLC PRO Module DEVELOPMENT, prior to the development the plates are pre-dried for 30 s, activated at 0–5% relative humidity for 10 minutes using a molecular sieve, and pre-conditioned with cyclohexane at a pump power of 35% for 300 s. No conditioning step is used. Development with cyclohexane to the migration distance of 30 mm from the lower edge of the plate, followed by drying for 5 min.
Documentation
Images of the plates are captured with the TLC Visualizer 2 in UV 366 nm.
Results and discussion
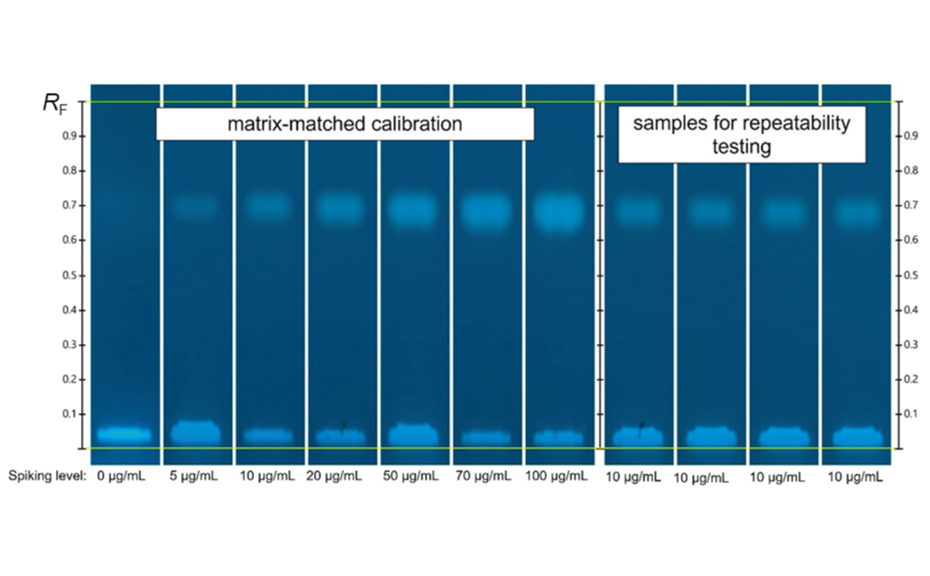
A calibration curve ranging from 5.0 μg/mL to 100.0 μg/mL was created by spiking aliquots of a milk sample with paraffin oil. For this purpose, the 2.0 mL samples were spiked with 1.0 –20.0 μL of the 10.0 mg/mL standard solution. Due to the short development distance of 30 mm, the development time is only 2 min. Considering activation, pre-conditioning, and drying, the complete development cycle is 30 min. This means that if 16 samples are applied to one HPTLC plate, the separation time per sample is only 1.8 min (6.7 min including application). As the HPTLC PRO system autonomously moves the plate from one module to the next, there is no time wasted due to manual transfer between the individual HPTLC steps. In the image of the developed plate in UV 366 nm, the first track is the not spiked milk sample, followed by the reference samples for the matrixmatched calibration and, on the last four tracks, the repeatability samples. The clear separation of the paraffin oil fraction from the other extracted fluorescent components is readily apparent. The lowest spike at 5.0 μg/mL is also clearly visible (second track from the left).

HPTLC chromatograms of matrix-matched calibration standards (from left: track 1–7) and repeatability samples (from left: track 8–11) in UV 366 nm after separation on the primuline impregnated HPTLC plate with a migration distance of 30 mm.
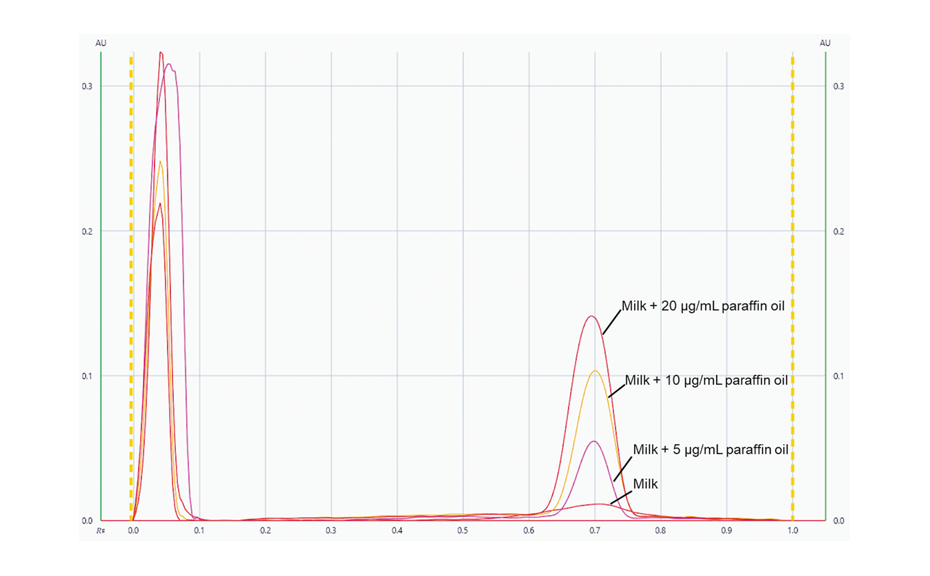
Using visionCATS, peak profiles from the image in UV 366 nm were generated for each individual track. Subsequently, the evaluation was conducted based on peak height.

Peak profiles from the image in UV 366 nm for the unspiked sample and the samples spiked with 5.0, 10.0 and 20.0 μg/mL of paraffin oil.
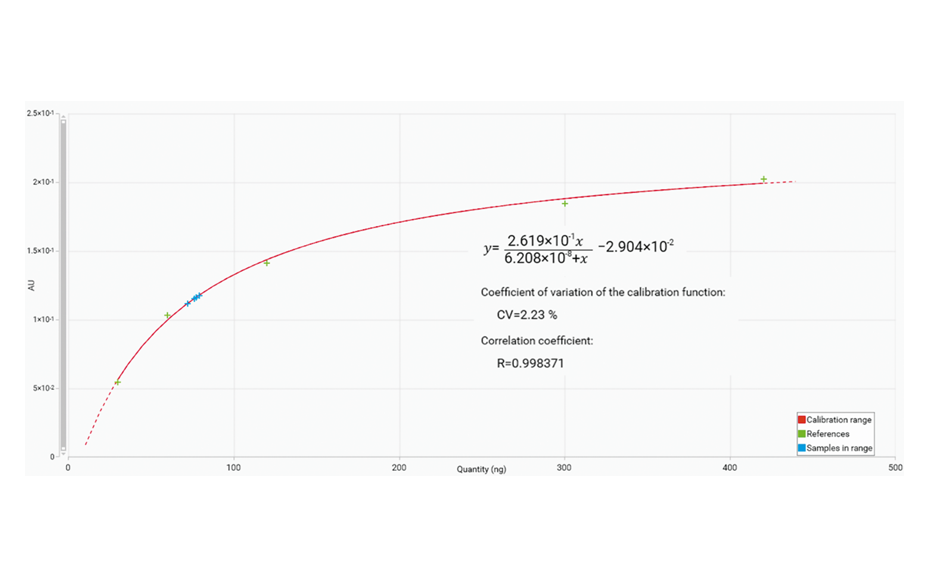
The calibration curve was generated using a Mime- 2 function. The calibration from 5.0 μg/mL to 70.0 μg/mL includes the results obtained for the four spiked samples (blue cross).

Calibration curve (from 5.0 μg/mL to 70.0 μg/mL) from the peak heights using the Mime-2 function.
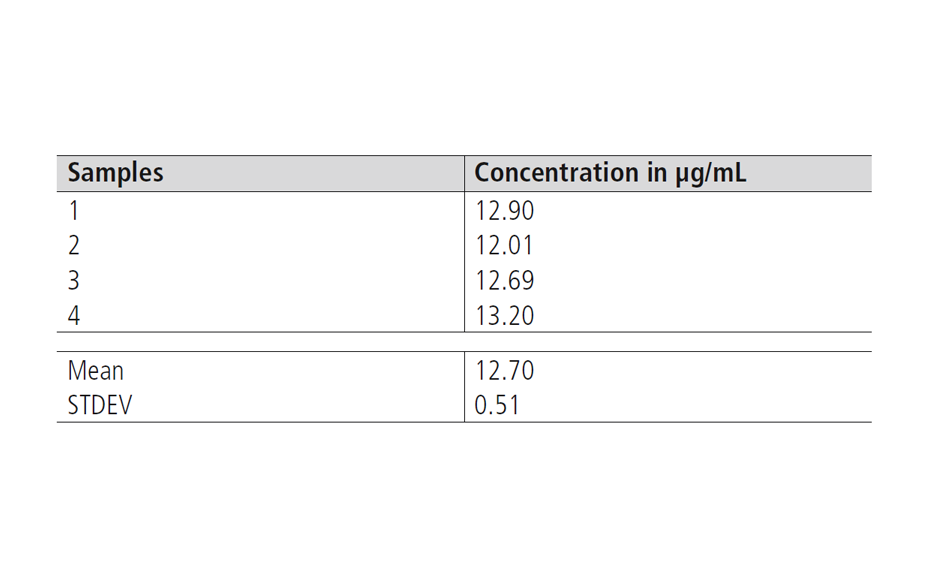
For the reproducibility of the extraction, an average value of 12.70 μg/mL, and a standard deviation (STDEV) of 0.51 μg/mL were obtained.

Table 1: Results of the reproducibility and recovery tests
This study demonstrates the rapid and simple, yet sensitive detection of paraffin oil in milk.
[Note]: for a proper quantification, a linear calibration curve would be needed.
Further information is available on request from the authors.
[1] M. Wagner and C. Oellig, J. Chromatogr. A ,1588 (2019) 48–57, https://doi.org/10.1016/j.chroma.2018.12.043.
Contact: Dr. Tiên Do, CAMAG, Sonnenmattstrasse 11, 4132 Muttenz, Switzerland, tien.do@camag.com